Kubernetes Monitoring Without kubectl: Deploy, Debug, and Fix Cluster Errors Faster with KubeKanvas


Kubernetes Monitoring Without kubectl: Deploy, Debug, and Fix Cluster Errors Faster with KubeKanvas
Kubernetes teams are moving fast, but traditional workflows are still stuck in context switching. You write YAML in one place. You deploy from terminal. You inspect logs elsewhere. You return to the editor. Then repeat. KubeKanvas monitoring was built to break that loop. With this release, teams can deploy workloads, monitor rollout health, inspect resource state, and troubleshoot errors from one visual workflow, without relying on kubectl for day-to-day operations.
This release is directly shaped by community feedback and shipped at a rapid pace. The message from users was clear: visual deployment is useful, but operational confidence comes from what happens after deploy. Monitoring needed to be first-class, not an add-on.
Our goal is to make Kubernetes as intuitive as the cloud was meant to be. We envision a world where infrastructure is no longer a barrier to innovation.
Why This Release Matters
Most kubernetes pain does not begin at resource creation. It begins after rollout starts:
- A pod enters
CrashLoopBackOff - A service is reachable from one namespace but not another
- An environment variable is missing
- A probe is misconfigured
- A dependent service starts late and causes startup failures
In a traditional setup, engineers jump between tools and lose precious time while incident pressure rises.
KubeKanvas monitoring changes this by unifying deployment and runtime feedback in one interface. Instead of translating errors between dashboards and terminals, teams can investigate directly where the release happened.
Community Feedback That Shaped The Feature
During early usage sessions, developers appreciated KubeKanvas for visual deployment and secret encryption. One recurring pattern still appeared: some users preferred writing YAML in IDEs, then copying manifests for deployment because debugging still felt easier in terminal-driven workflows.
That signal mattered. The product direction became clear:
- Keep visual deployment simple.
- Make monitoring operationally deep.
- Reduce terminal dependency for common deploy and debug scenarios.
- Add guided recovery with AI where teams need help most.
After launching the monitoring feature, the same developer group reported a major improvement in confidence and speed. Users tested many templates from the KubeKanvas template database and gave deeper operational feedback, especially around release visibility and troubleshooting flow.
That validation confirmed the strategy: fast community loops produce practical features.
What You Can Do Now Without kubectl
With KubeKanvas monitoring, teams can complete core tasks without dropping into terminal commands for every issue:
- Trigger and track releases from the project workflow
- View rollout status in real time
- Inspect workload and pod health
- Open error context where failures occur
- Use AI suggestions from error state
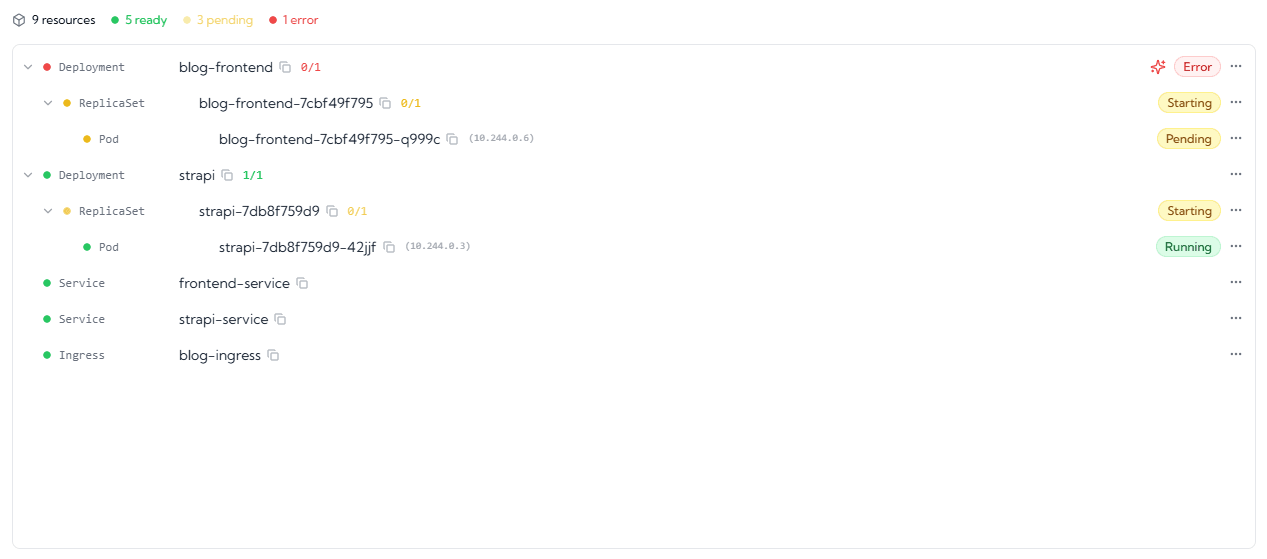
- Apply fixes and re-deploy faster
kubectl might be needed for advanced scenarios, but it is no longer required for the default development and troubleshooting path.
Step-by-Step: How to Use KubeKanvas Monitoring
1. Start deployment from your project
Open your project in KubeKanvas and trigger the release from the deployment workflow.
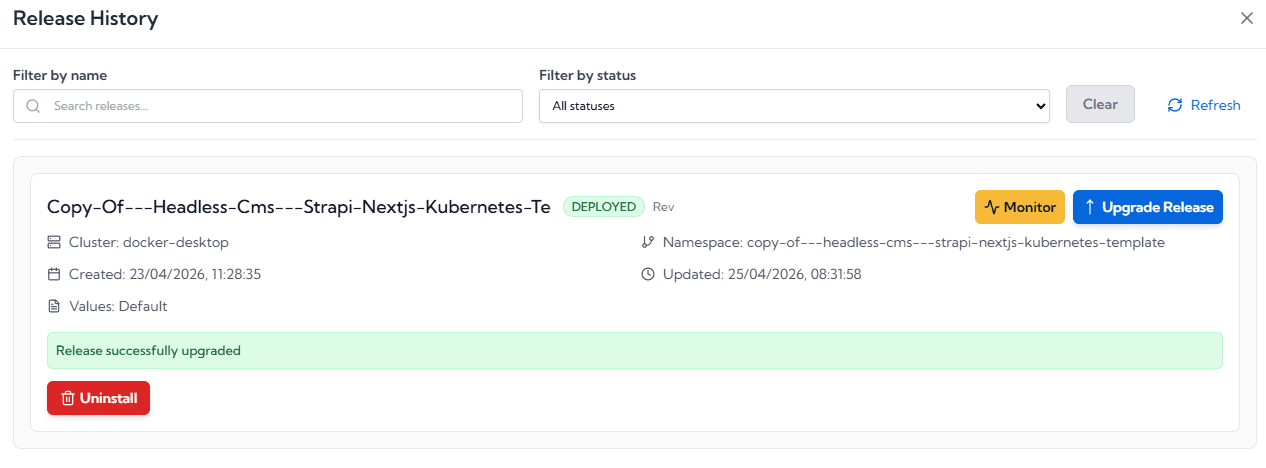
2. Open the Release Monitoring view
As deployment progresses, open monitoring to see rollout stages, health signals, and status transitions. This view is focused on the resources created by the release you just created or upgraded, so you are not distracted by noise from the rest of the cluster. The status is derived from the status fields inside Kubernetes resource objects, giving you a reliable, real-time signal of what is actually happening. Color coding tells you in less than a second where to focus, what is wrong, or, if you are lucky, a fully green view that gives you immediate peace of mind.
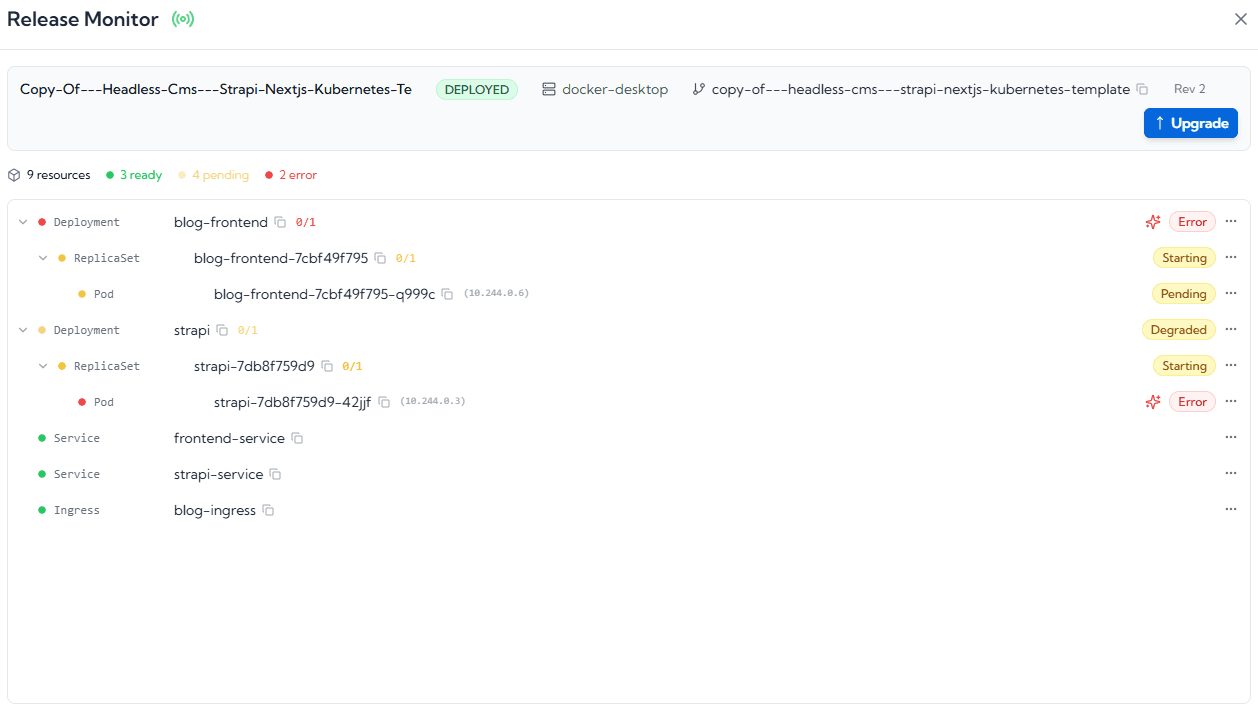
3. Inspect workload and pod-level state
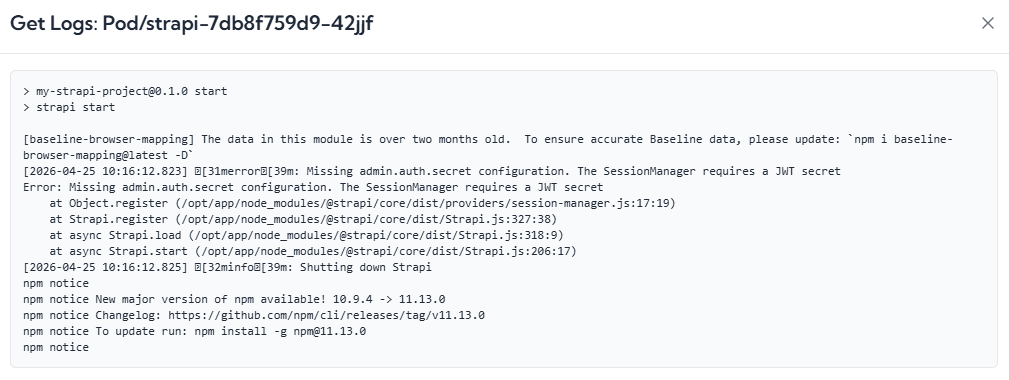
Click into a specific workload or pod to inspect live status and identify where failure begins. If a pod is in an error state, you can invoke AI right there in the browser to help fix the issue. AI can check pod logs and describe the resource context without forcing you to jump into terminal commands. This removes the burden of switching from IDE to terminal and back again, so you can focus on solving the problem instead of hunting for where to investigate it.
4. Investigate errors in-context
When rollout fails, KubeKanvas surfaces error state in the same operational view so teams can investigate immediately.
5. Use AI-assisted troubleshooting using Kaygent
Click the AI icon next to the error to get guided diagnosis and actionable recovery steps. You do not need to type the problem manually. The editor pre-fills the issue for AI and includes the release context automatically, so there is no need to search, copy, and paste status details yourself. Sensitive values are sanitized before context is sent, so secrets are protected while AI still receives enough operational detail to provide useful fixes.
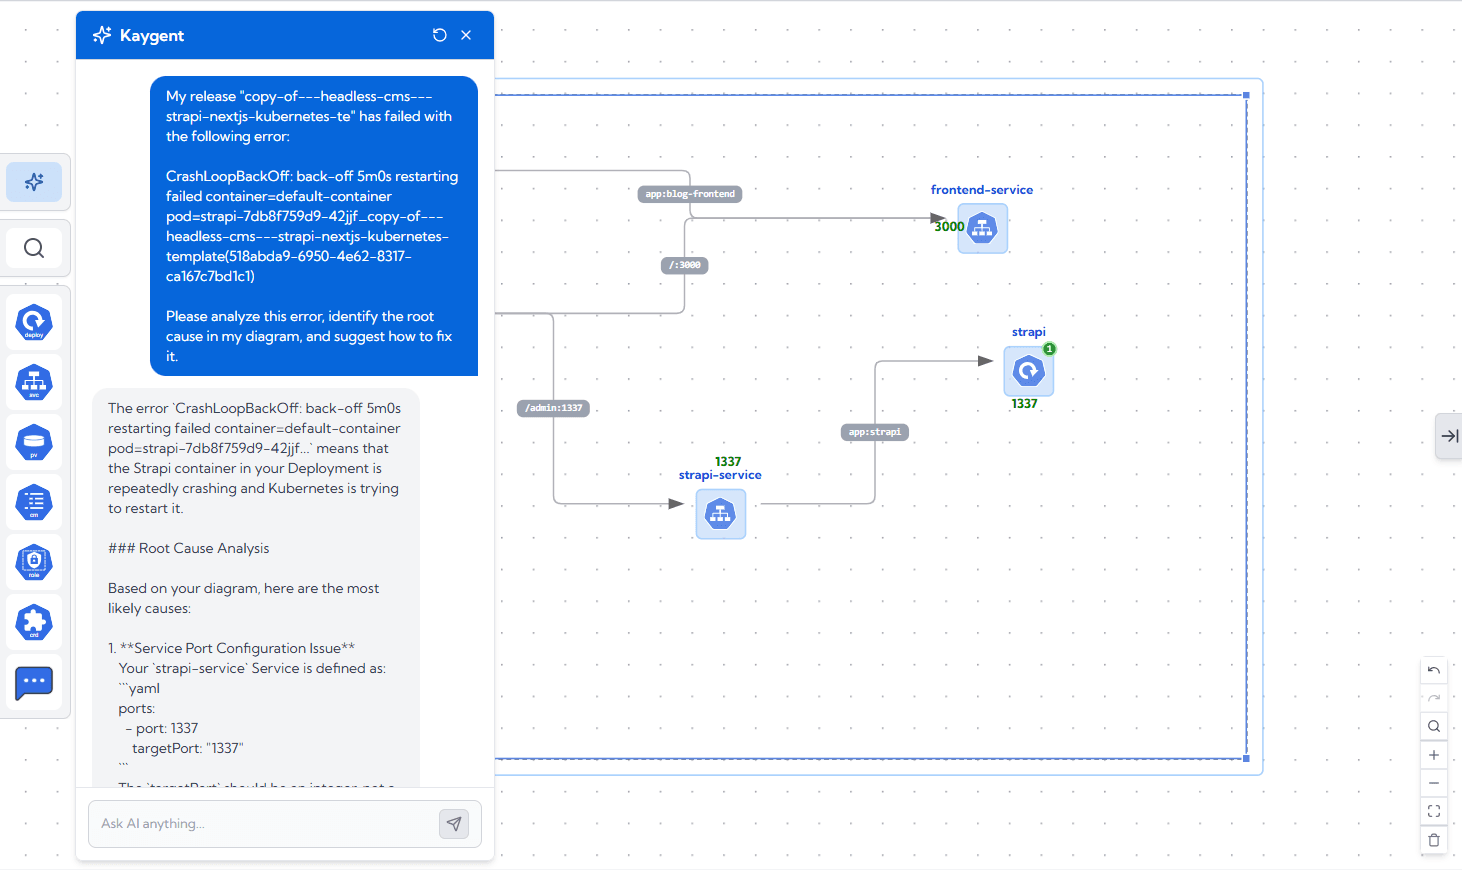
When the AI icon is invoked from an error state, KubeKanvas AI helps teams by:
- Reading relevant deployment and runtime context.
- Explaining probable root cause in clear language.
- Suggesting practical fixes and next actions.
- If you allow, if will fix the issue directly in the yaml.
This is especially useful when teams are onboarding to Kubernetes, handling unfamiliar workloads, or operating under release deadlines.
Typical Problems This Monitoring Flow Helps Solve
Rollout failures
Detect failed rollout quickly and inspect resource state without leaving the deployment workflow.
CrashLoopBackOff and startup errors
See failure context at pod level and use AI-assisted guidance for faster triage.
Misconfiguration issues
Find common issues like missing env values, invalid resource references, or probe mismatches.
Slow incident response
Reduce handoff friction by giving developers and platform engineers one shared operational view.
Analyze application logs and suggest a fix
For example if a release fails because of a misconfigured database connection, Kaygent can inspect the context and application logs, identify the likely configuration mismatch, and suggest or apply the fix.
Why Teams Are Adopting This Workflow Faster
KubeKanvas monitoring supports how modern teams actually work:
- Faster feedback loop from deploy to diagnosis
- Better collaboration across platform and application roles
- Lower cognitive load from fewer tool switches
- Better confidence when shipping frequently
When monitoring and deployment are connected, debugging becomes less reactive and more predictable.
KubeKanvas Vision for Kubernetes Operations
KubeKanvas is investing in a community-first product cycle with rapid delivery on real user pain points.
The mission is clear:
- Make Kubernetes approachable for teams of all sizes
- Turn operations from command-heavy to insight-driven
- Remove infrastructure complexity as a blocker to product innovation
Our goal is To make Kubernetes as intuitive as the cloud was meant to be. We envision a world where infrastructure is no longer a barrier to innovation.
Frequently Asked Questions
Do I still need kubectl with KubeKanvas monitoring?
For many daily deployment and debugging workflows, no. KubeKanvas now covers the primary path inside the product experience.
Is this only for beginners?
No. Advanced users benefit from faster feedback loops and less context switching, while newer users gain guided troubleshooting support.
Can AI automatically fix every error?
AI provides contextual recommendations and practical recovery guidance. Some issues still require environment-specific decisions from your team.
Is this feature useful for platform teams?
Yes. Shared monitoring visibility improves collaboration between platform engineers and application developers.
Final Takeaway
Kubernetes does not need to feel fragmented.
With KubeKanvas monitoring, teams can deploy, observe, investigate, and recover from one integrated workflow. That means less time switching tools and more time shipping reliable software.
If your team wants to reduce dependence on kubectl for routine deployment and debugging, this release is built for exactly that.


